 PQL Procedures


|
| PQL Procedures | | Descriptive |
DESCRIPTIVE procedure produces a frequency barchart and descriptive statistics on a numeric or short string (up to eight characters) variable. Frequency counts show how many times a variable had a particular value, or had a value which fell within a range.
     DESCRIPTIVE  VARIABLE = var
                       [ BOOLEAN = (log_expression) ]
                       [ FILENAME = ldi ]
                       [ HTML ]
                       [ INTERVALS = (n,n+,n++,...)]
                       [ RANGE = (categories,min,max)]
                       [ SAMPLE = sample]
                       [ STRINGS   = ('n','n+','n++',...)]
                       [ SUBTITLE = 'text' ]
                       [ TITLE    = 'text' ]
                       [ WEIGHT   = varname]
Specify a variable name. This produces a frequency table and counts of included
observations (values in the frequency table) and missing observations (missing and
undefined values) plus a set of descriptive statistics.
Default frequency ranges for numeric variables are calculated from the minimum and maximum values of observations. The number of ranges is taken from the square root of the number of observations with a minimum of seven and a maximum of fifty.
There are no default ranges for string variables and these must be specified as part of the STRING parameter.
BOOLEAN
| Specifies which procedure table records are used by the procedure. The procedure table records for which the logical expression is true are used by the procedure. If this option is not specified, all procedure table records are used. |
FILENAME
|
Specify the filename
created by the procedure. If no FILENAME clause is specified, the output is written to a default file sirdesc.srg.
If the filename |
HTML |
Specifies that output is produced in HTML format suitable for viewing through a browser. |
INTERVALS
|
Specify a set of values, in increasing order, that represent the
boundaries of the ranges in the frequency table. Values below the first and
beyond the last value are omitted. For example, to create three ranges for
Salary:
      DESCRIPTIVE  VARIABLE = SALARY /
                   INTERVALS = (0,2000,3000,9999)
Cannot specify both INTERVALS and RANGES. |
RANGE
|
Specify that the frequency table consists of n ranges with the specified lowest and highest limits. Values below the first and beyond the last value are omitted. For example, to create three ranges for Salary (0-2000,2000-4000,4000-6000):
      DESCRIPTIVE  VARIABLE = SALARY /
                   RANGE = (3,0,6000)
|
SAMPLE
|
Specifies that a random sample of the procedure table records is used by the procedure. The fraction specifies the percent of records used and is specified as a positive decimal number less than or equal to 1 (one). .25, for example specifies that a 25% sample be used. |
STRINGS
| Specifies that the variable to be analysed is a string (up to eight characters in length) and the set of values to use for the frequency chart. Specify a set of values, in increasing order, that represent the boundaries of the ranges in the frequency table. Values below the first and beyond the last value are omitted. Note that descriptive statistics are not produced for strings. |
SUBTITLE
|
Specifies the text on the DESCRIPTIVE report
footer. Enclose the text in quotes. If SUBTITLE is not
used, the subtitle is "Created by SIR/XS on DATE at TIME".
|
TITLE
|
Specifies the text on the DESCRIPTIVE report
title. Enclose the text in quotes. If TITLE is not
used, the title is the variable label or name when no label.
|
WEIGHT
|
Specifies the procedure variable used as a weighting factor for the
variables in FREQUENCIES. Normally, cell counts are
incremented by one for each appropriate occurrence. When a weighting value is
specified, the cell count is incremented by the value in the specified variable.
|
| |
EDUC).
RETRIEVAL
PROCESS CASES
. PROCESS REC EMPLOYEE
. GET VARS EDUC
. PERFORM PROCS
. END REC
END CASE
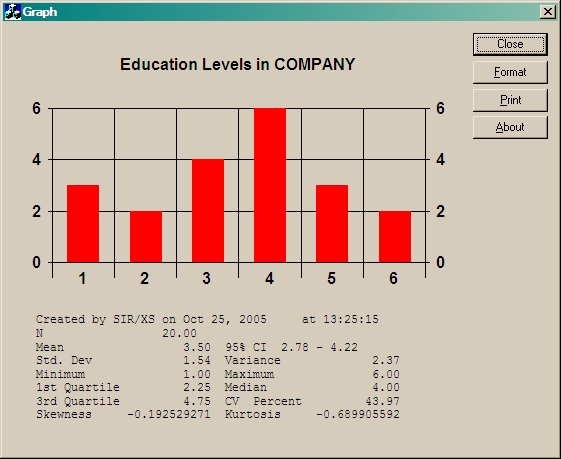
DESCRIPTIVE VARIABLE = EDUC
FILENAME = EDUC.SRG /
TITLE = 'Education Levels in Company' /
END RETRIEVAL
On completion of the program, the file EDUC.SRG contains text which can be viewed with
ESCAPE 'sirgraph.exe educ.srg'which looks something like:
RETRIEVAL
PROCESS CASES
. PROCESS REC EMPLOYEE
. GET VARS SALARY
. PERFORM PROCS
. END REC
END CASE
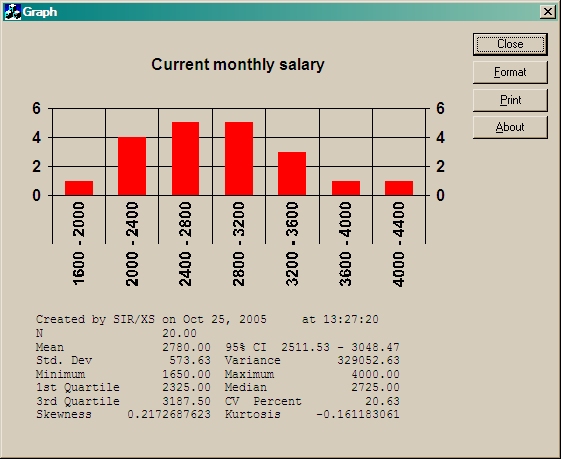
DESCRIPTIVE VARIABLE = SALARY /
FILENAME = SALARY.SRG /
END RETRIEVAL
On completion of the program, the file SALARY.SRG contains text which can be viewed with
ESCAPE 'sirgraph.exe salary.srg'which looks something like:
RETRIEVAL
STRING*4 SNAME
PROCESS CASES
. PROCESS REC EMPLOYEE
. COMPUTE SNAME = NAME
. PERFORM PROCS
. END REC
END CASE
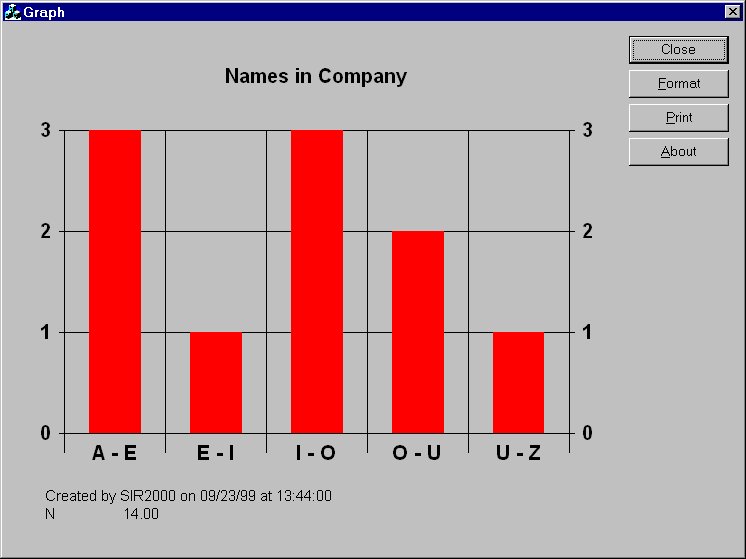
DESCRIPTIVE VARIABLE = SNAME /
FILENAME = NAMES.SRG /
STRING = ('A','E','I','O','U','Z') /
TITLE = 'Names in Company' /
END RETRIEVAL
On completion of the program, the file NAMES.SRG contains text which can be viewed with
ESCAPE 'sirgraph.exe names.srg'which looks something like:
RETRIEVAL
PROCESS CASES
.  PROCESS REC EMPLOYEE
.    GET VARS SALARY
.    PERFORM PROCS
.  END REC
END CASE
DESCRIPTIVE VARIABLE  = SALARY
         RANGE = (8,1000,5000)
         FILENAME   = SALARY.HTM   HTML
END RETRIEVAL
On completion of the program, the file SALARY.HTM contains text which can be viewed with any browser which looks something like:
| Values | Frequency |
| 1000 - 1500 | 1 |
| 1500 - 2000 | 0 |
| 2000 - 2500 | 3 |
| 2500 - 3000 | 5 |
| 3000 - 3500 | 2 |
| 3500 - 4000 | 0 |
| 4000 - 4500 | 1 |
| 4500 - 5000 | 0 |
| 1000 - 1500 | 1500 - 2000 | 2000 - 2500 | 2500 - 3000 | 3000 - 3500 | 3500 - 4000 | 4000 - 4500 | 4500 - 5000 |
| Number of Observations | 12.00 |
| Number of Missing Observations | 2.00 |
| Mean | 2702.83 |
| Standard Deviation | 678.84 |
| Variance | 460823.61 |
| Minimum | 1234.00 |
| Maximum | 4000.00 |
| First Quartile | 2337.50 |
| Median | 2725.00 |
| Third Quartile | 2962.50 |
| Mean (95% C.I) | 2271.52 - 3134.15 |
| CV Percent | 25.12 |
| Skewness | -0.288310643 |
| Kurtosis | 1.7548682 |
| |